As co-founder of sound system design and acoustics consulting startup Stampede Sound here in NYC, one of the principal goals of our operation has been to reduce noise transmission for small clubs and bars in the city while improving sound quality with our proprietary speakers and acoustical knowledge. Of all places to achieve this in the US, NYC is likely the most challenging: high population density, hundreds of bars and venue spaces in close proximity to residential spaces, and constantly changing neighborhood boundaries.
A low density part of town can transform into an entertainment center and population center within just a few years and with it, shifting expectations for residents of that neighborhood. Both the businesses that serve the residents and new residential property construction are in a complicated dance with each other.
Beyond the incredible cost of operating a bar or nightclub, there is one threat to the longevity of these establishments that is most existential: 311 Noise Complaints. No matter how successful, a sustained period of 311 Noise Complaints from residential neighbors can permanently shut down the operation.
To track down the biggest offenders in this business space would be a huge boon not just for my company but any services that attempt to improve a part of the urban entropy which keeps the neighbors and businesses biting their fingernails.
Come, the NYC Open Data initiative’s 311 Noise Complaint Dataset.
After filtering the list down to the relevant data points, we’re down to the following:
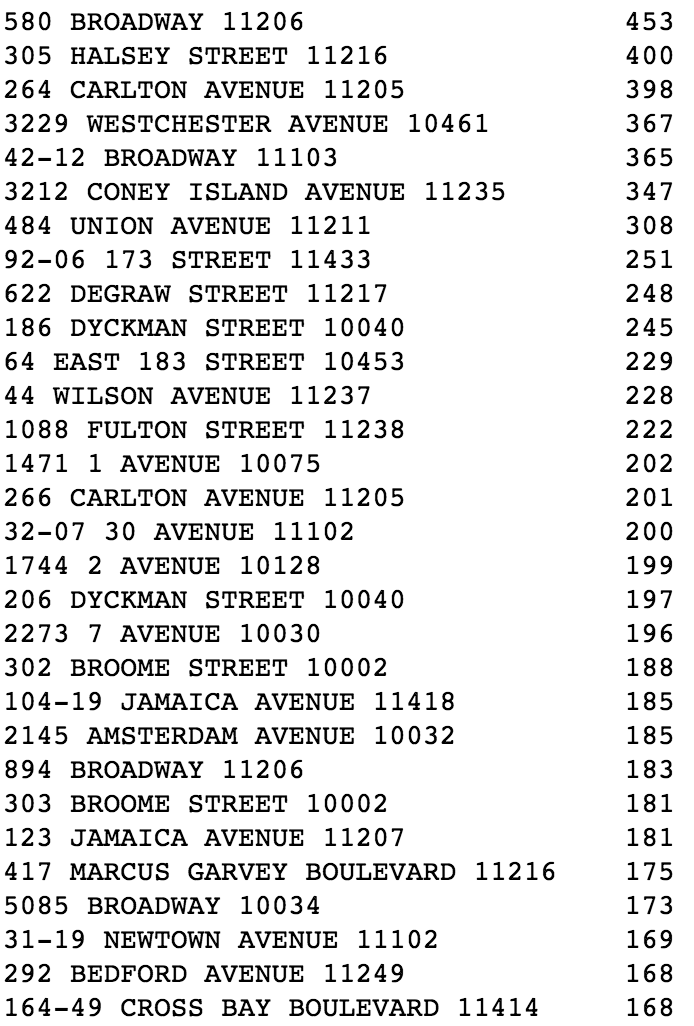
We turn it into a Dataframe, run the Google Maps Places API against these addresses and get the following list:
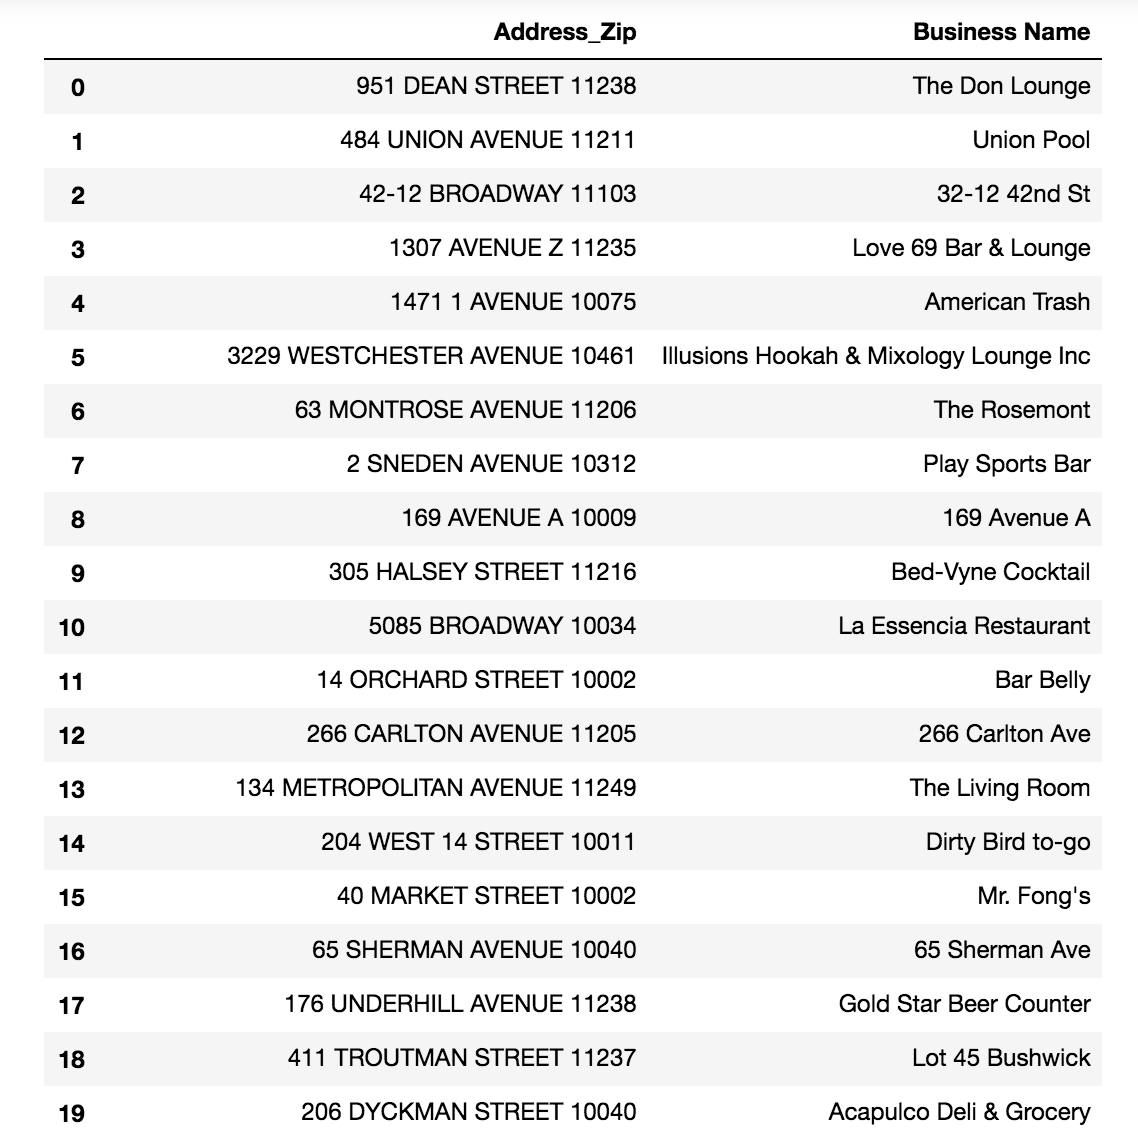
We then create a “Rank” column which allows us to rank the top 100 places with a “1” to “100” ordinal scale.
![]()
We are now ready to plot our points utilizing the jupyter-gmaps API . The visualization tool which reveals the establishment name, its noise rank and its location can be immediately utilized by my sales team. An invaluable tool for lead generation.
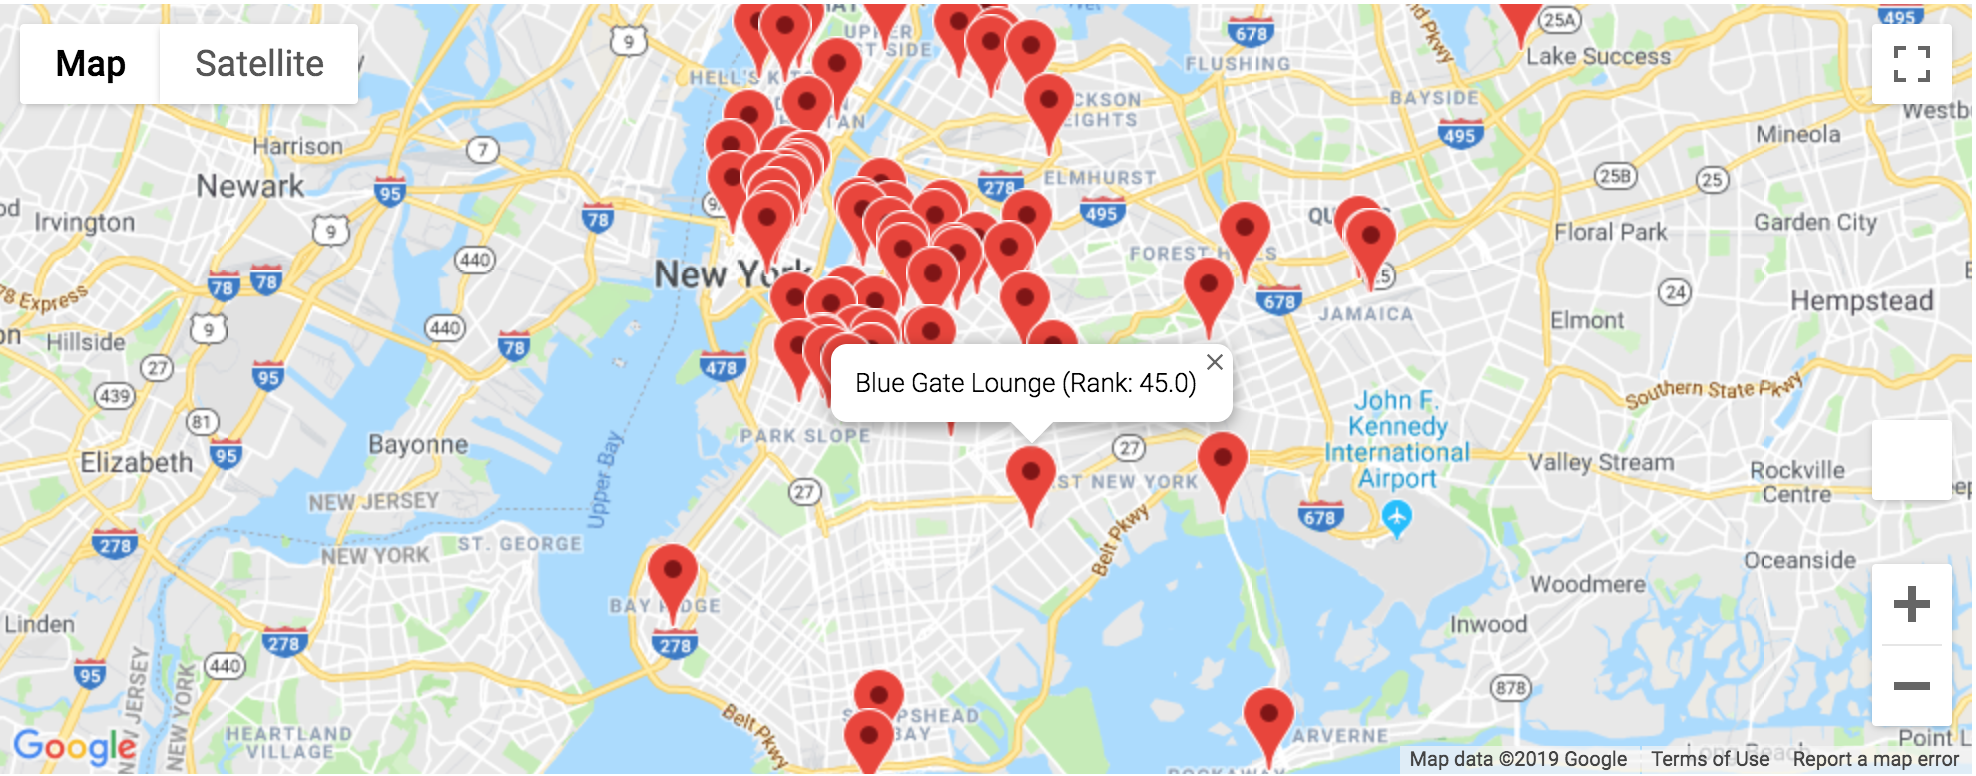
The visualization reveals nightlife noise hotspots and a multitude of other location data that can be applied to other NYC Open Data datasets for further analysis.
Sample Dashboard View
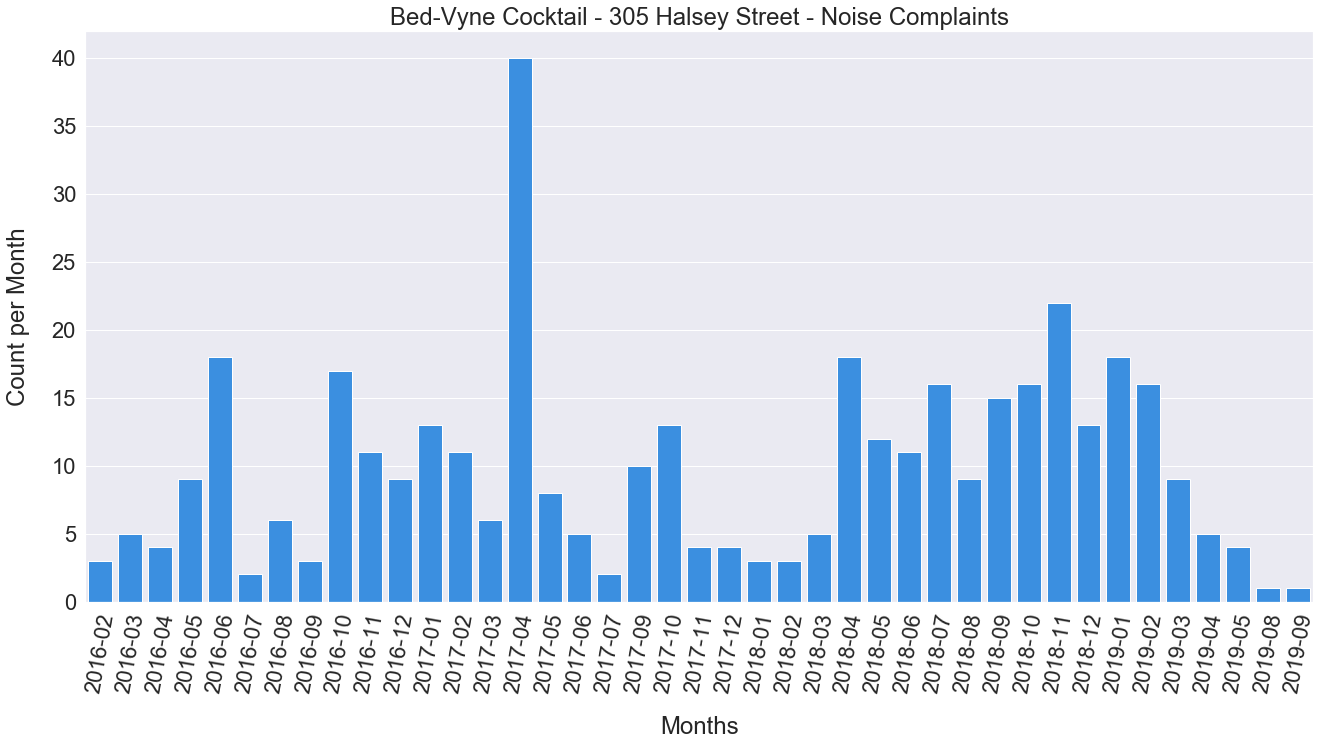
For each specific sales cycle, we can generate a graph providing historic noise complaint trends for each business and can be generated for Stampede Sound’s existing clients for true on-the-ground field testing.